|
|
Intelligent Student Ranking via Efficient Multivariate Analysis |
INVESTIGATORS
Dr. Yisong Chen et al.
KEYWORDS:
Multivariate analysis, factor analysis, multidimensional scaling, rule induction, feature selection, dimensionality reduction, data visualization, support vector machine.
BRIEF DESCRIPTION
A novel multivariate analysis based algorithm is proposed to analyze the ranking rules from students’ subject score data. The framework comprises three major steps. Firstly, factor analysis is adopted to separate the scores of several different subjects into unrelated scores and related scores. Secondly, multidimensional scaling is employed to the cleaned data to reduce the dimensionality and give an easily interpretable visualization. Finally, support vector classifier is used to classify the points in the new noise-free feature space into different categories according to the given training sets. This rule induction approach exhibits the advantages of easy intuitive interpretation and high classification accuracy.
Our algorithm will be given in the context of analysis of a primary school student dataset. One interesting work is about automated ranking given several subject scores. One major barrier here is that the rank is not given in an easily handled interval scale format, but a somewhat troublesome nonmetric ordinal scale. This prevents the problem from being solved with the popular multiple regression method. It is unlikely to be as simple as a weighted average followed by a quantization because many inconsistent results are produced with this strategy. This observation makes we doubt whether all subjects are equally involved in the hidden rank evaluation procedure. Maybe some subjects only account for very small weights in rank evaluation or even can be fully ignored. If this is the case, a wise choice is to wipe off these “unrelated” scores before going on. After removing these noisy data, we expect a clearer pattern will show up by some additional similarity based dimension-reduction processing. Factor analysis and multidimensional scaling are two natural choices that helps perform the above tasks.
Step 1. Feature selection by factor analysis
Broadly speaking, factor analysis starts with an assumption of the factors and proceeds by fitting this model to the data. This procedure meets our demand here quite well. Specifically, we reasonably assume that there are two common factors. One closely associated with the ranking related subjects and the other with the ranking unrelated subjects. Under this model, we try to find one solution that helps us better understand and interpret the data. Namely, we expect that ranking-related subjects will heavily load on the ranking-related common factor, and vice versa.
By employing a two-factor factor analysis we can clearly see the impact of the two factors on the six subjects. Both results for the non-rotation and the oblique rotation with the promax criterion are given in Figure 1.
Figure 1. Factor analysis result
clearly, subjects 1-4 are mainly dominated by factor 1 and subjects 5-6 are closely related to factor 2. This result neatly divides the six subjects into two disjoint groups.
Step 2. Dimensionality reduction and visualization by multidimensional scaling
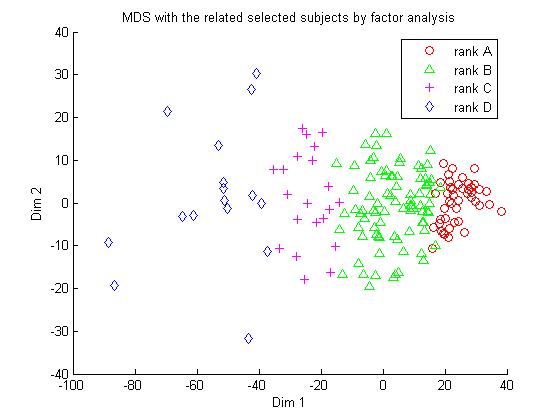
In the context of rank evaluation an ideal visualization should be able to characterize the global distribution as well as the similarities between individuals. Multidimensional scaling (MDS) meets the above requirement quiet well. MDS is a powerful tool to obtain spatial representations from multivariate observations based solely on their similarities or proximities [Latting2003]. Its capacity of creating a map of observations in a reduced number of dimensions helps to gain a fundamental understanding of the perceived dimension. In this application, with the score table the Euclidean distances between different observations is well defined and metric MDS is readily applicable.
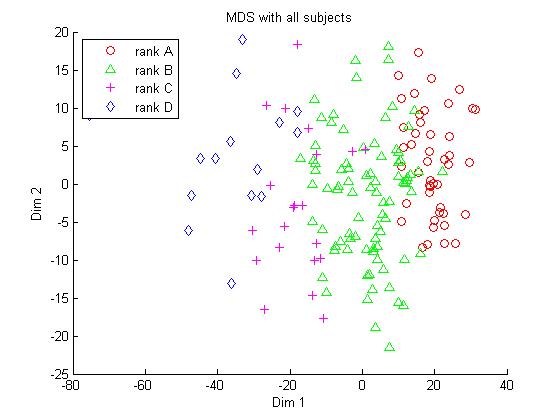
Figure 2. Distribution comparison with two different feature selection strategies.
(a) MDS result with the scores of the four subjects selected by factor analysis. (b) MDS result with the scores of all six subjectsStep 3. Ranking simulation by support vector classifier
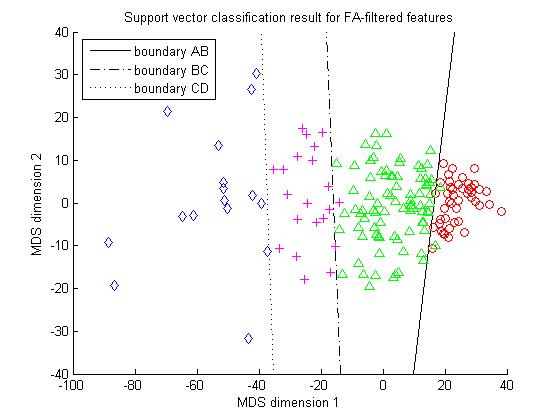
Support vector machine is well suited for handling the ranking simulation problem here. Due the good data pattern shown in Figure 2, it is easily extended to separate four different ranks by designing three SVMs to perform A-B, B-C and C-D separating respectively. Our experiment involves a sample of 166 students from the same grade. The students of each rank level are partitioned into a training sample and a holdout sample with the ratio 2:1. The support vector classification results for the two distributions in figure 2 are given in Figure 3.
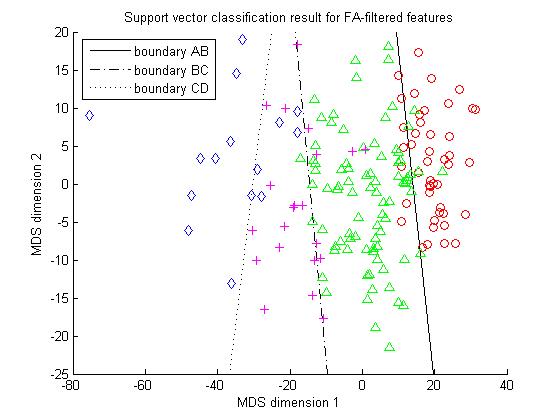
(a) SVM classification for the unfiltered data. (b) SVM classification for the filtered data.
Figure 3. Support vector classification results comparison for filtered and unfiltered
Figure 3 shows that SVM classifier working on the filtered features significantly outperforms its competitor working on the unfiltered features. The overall accuracy is about 98% vs. 88%. This again verifies that factor analysis based feature selection is a very effective and promising method.
FUNDING AGENCY
N/A
PUBLICATIONS
Yisong Chen, Horace H.S. Ip, Sheng Li, Guoping Wang. Discovering hidden knowledge in data classification via multivariate analysis. Expert Systems, Vol. 27, No. 2, pp. 90-100, 2010.