|
|
CAD based SARS detection in chest radiograph |
INVESTIGATORS
Dr. Yisong Chen et al.
KEYWORDS:
Computer aided diagnosis, Medical image processing, Spline interpolation, Computational geometry, Statistical analysis.
BRIEF DESCRIPTION
Since SARS lesions are difficult to find in chest radiograph automatically, we design a semi-automatic user interface to help detect possible SARS lesions and collect relative information. With this interface, experienced doctors can easily mark SARS lesion regions in the chest radiograph, compute their geometric and statistical features, and save the information for future study.
Several sample interfaces at different processing stages are shown in figure 1. The operation routine is briefly outlined as follows.
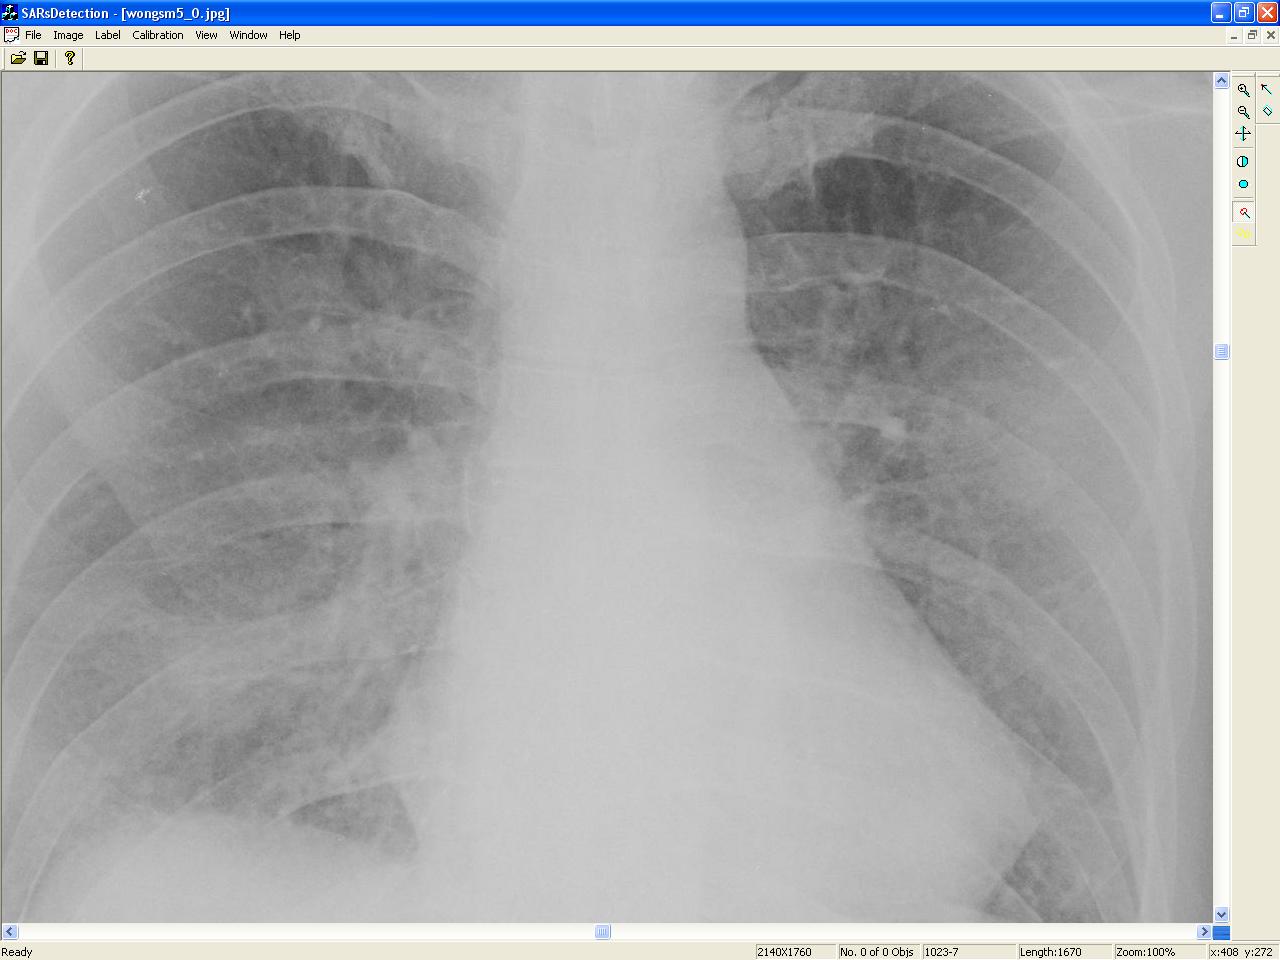
Figure 1-1. Loading the original image Figure 1-2. Marking a lesion region
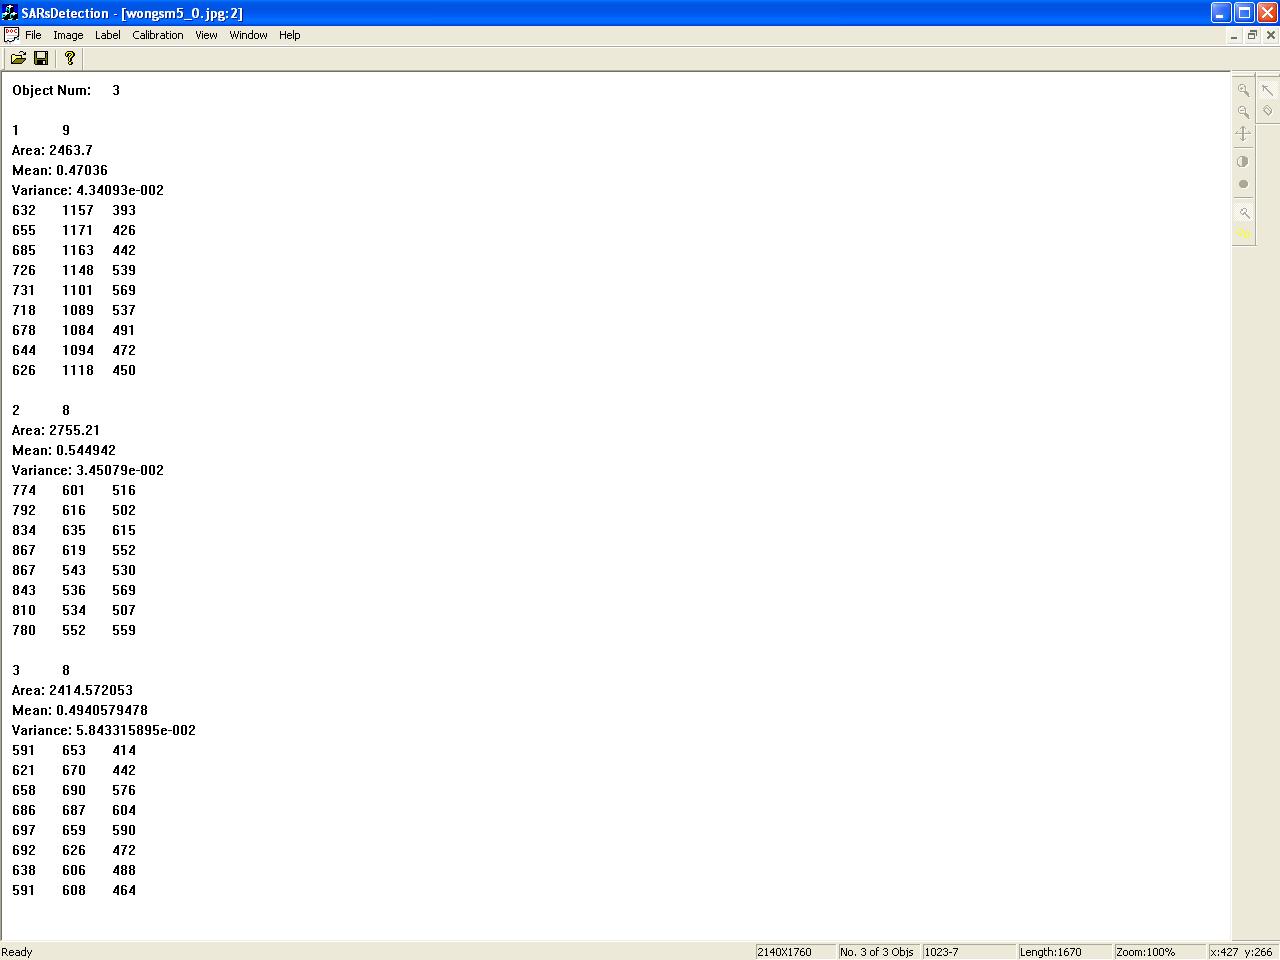
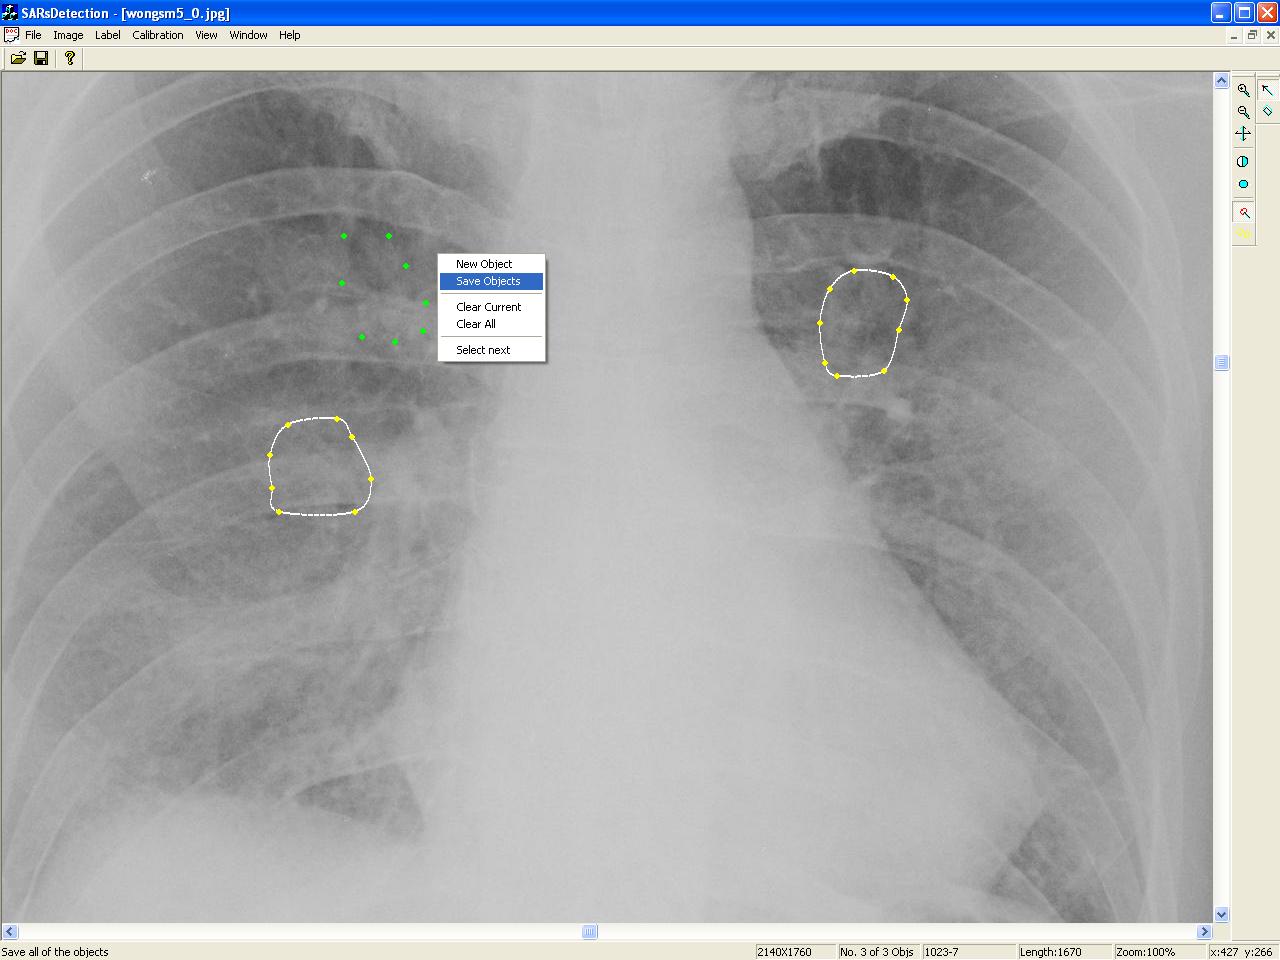
Figure 1-3. Several marked regions Figure 1-4. Some example statistical data
We use a cubic spline to interpolate all feature points of one lesion object and create a closed region. This means that between each two points, there is a piecewise cubic curve. When we string these curves together, we set the second and first derivatives at the endpoints of each piecewise cubic curve equal to that of the adjacent cubic curve's second and first derivatives thus providing for a continuous second derivative. This gives a smooth closed curve that passes through each point, thus interpolating them.
After spline interpolation it is possible to estimate the area of the closed region encircled by the boundary curve. The raster structure of digital image is ideally suited for area calculation. Via scanning the bounding box of the object line by line we can easily calculate the total number of pixels contained within the area, n, and the total number of pixels on the boundary curve, m.
The statistical properties of a lesion object can be conveniently described by its moments. Two most important moments are mean and variance, which can be computed using equation (1) and (2)
(1)
(2)
where n is the total number of pixels in the closed region and xi is the brightness of the i-th pixel.
When required by the user, the system will display the area, the mean and the variance values of all valid objects in an information window, as shown in Figure 1-4.
FUNDING AGENCY
N/A
PUBLICATIONS
N/A